
H.4.1 Fed Liquidity Intelligence Report
Liquidity Report
Monetary Liquidity
This report tracks the net creation and withdrawal of dollar liquidity from the financial system. By monitoring Federal Reserve operations, Treasury cash management, and reserve balances, it assesses the monetary environment that supports financial asset valuations and risk-taking behavior.
Treasury Rebuilds Cash; Reserves Give Ground
The weekly average confirms the drain, even as bank borrowing retreats.
Key figures · Federal Reserve H.4.1, Wednesday Nov 18, 2026
Reserve balance
$3,001.8B
+$31.8B on the week
Treasury General Account
$892.3B
-$19.8B on the week
Total Federal Reserve Assets
$6,741.5B
-$17.4B on the week
Agency Mortgage-Backed Securities
$1,883.5B
-$0.1B on the week
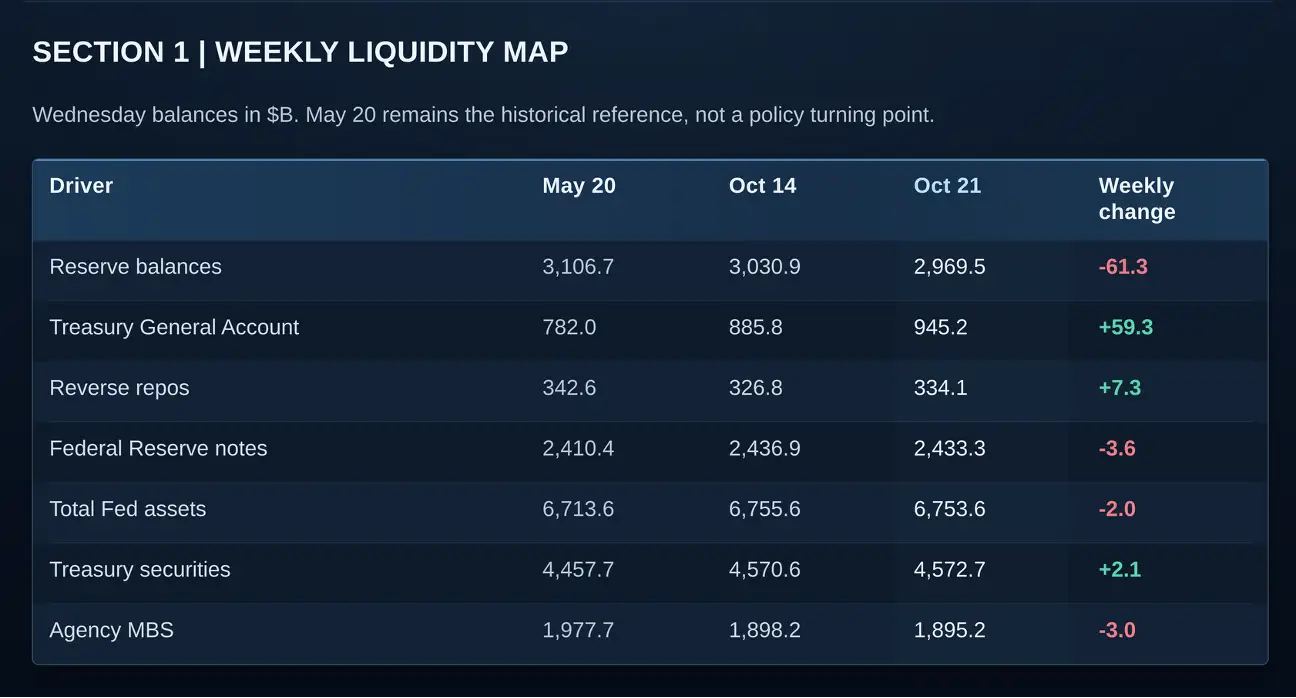
Chart from the latest issue
What the chart reveals
Reserve balances fell $61.3B to $2,969.5B in the week to October 21, while the Treasury General Account rose $59.3B to $945.2B, an accounting contribution equal to 96.7% of the reserve decline. Reverse repos added $7.3B of pressure and total Fed assets barely moved (-$2.0B). Reserves now sit $137.2B below the May 20 reference: a cash-drain signal with orderly funding prices, not evidence of a marketwide funding break.
The H.4.1 Fed Liquidity Intelligence Report tracks these underlying money flows weekly, revealing the financial conditions and emerging risks that headline numbers alone can conceal.
Plans from $19.95/month · delivered every week
Free Weekly Report Brief
Fresh perspectives, sharper understanding, and better-informed investment decisions.
The data tells the real story - we reveal why it matters. Each week, our free Report Brief explores the actual US Fed and Treasury financial forces shaping markets, drawing on our proprietary Fed Liquidity, Funding Stress and Treasury Auction research. From emerging trends and overlooked risks, to surprising developments and important financial questions, we connect the dots, simplify complex subjects and turn the latest financial information into practical investor insights.
Free Weekly Intelligence Brief - Unsubscribe Anytime - We Never Share Your Email
Want the Full Report Every Week? Compare Plans in the Document Locker