
US Funding Stress Intelligence Report
Funding Stress Report
Funding Conditions
This report measures the health of the financial system's funding markets. Through analysis of repo financing, short-term interest rates, and liquidity facilities, it evaluates whether capital is flowing efficiently through the institutions that underpin market functioning.
Less Cash, Without a Rate Break
Treasury rebuilt cash, reserves contracted, and funding risk rose while overnight prices held steady.
Treasury yields · as of Nov 20, 2026 (U.S. Treasury par yield curve)
1-Month Bill
4.19%
2-Year Note
4.63%
10-Year Note
4.92%
30-Year Bond
5.31%
Our weekly Overnight Rate Corridor reveals what interest rates alone cannot: how money actually moves through the banking system. By tracking four critical funding rates and their relationships (spatially), this visual snapshot exposes liquidity conditions, funding pressures, and potential market stress at a glance. It helps investors distinguish a smoothly functioning financial system from one beginning to show signs of strain.
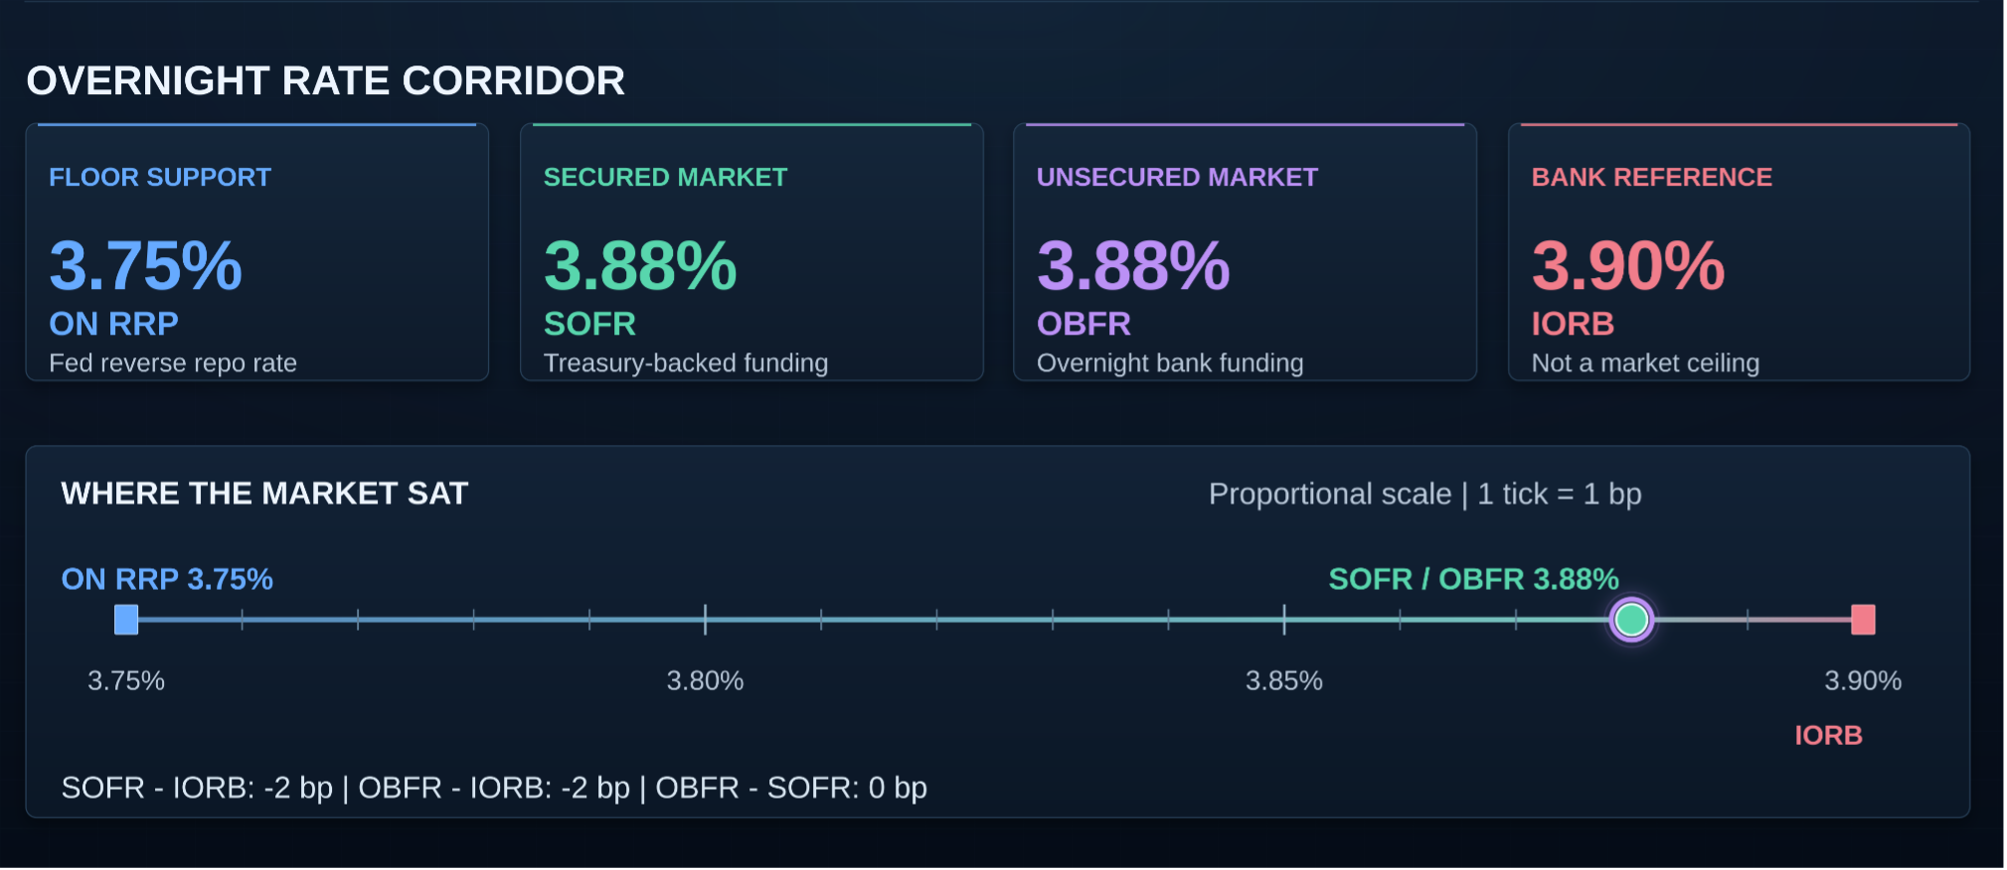
Chart from the latest issue
What the overnight rate corridor reveals
On October 21, SOFR, OBFR and effective fed funds all finished at 3.88%: 13 bp above the 3.75% ON RRP floor and 2 bp below the 3.90% IORB reference. Overnight prices held inside the corridor even as Wednesday reserves fell $61.332B, so funding capacity weakened faster than funding prices. Equal SOFR and OBFR readings show one price across secured and unsecured markets, not identical access.
The US Funding Stress Intelligence Report extends this analysis beyond headline interest rates, connecting funding costs, reserve availability, and liquidity momentum to identify emerging financial pressures and potential market vulnerabilities that conventional rate observations alone may fail to reveal.
Plans from $19.95/month · delivered every week
Free Weekly Report Brief
Fresh perspectives, sharper understanding, and better-informed investment decisions.
The data tells the real story - we reveal why it matters. Each week, our free Report Brief explores the actual US Fed and Treasury financial forces shaping markets, drawing on our proprietary Fed Liquidity, Funding Stress and Treasury Auction research. From emerging trends and overlooked risks, to surprising developments and important financial questions, we connect the dots, simplify complex subjects and turn the latest financial information into practical investor insights.
Free Weekly Intelligence Brief - Unsubscribe Anytime - We Never Share Your Email
Want the Full Report Every Week? Compare Plans in the Document Locker